Displaying the data
Example
Now that we have all the dimensions we can construct a call using CitySDK. Let’s find the percentage of households in all New York counties that own one or more vehicles.
1.Search for the table at data.census.gov, then locate the source.
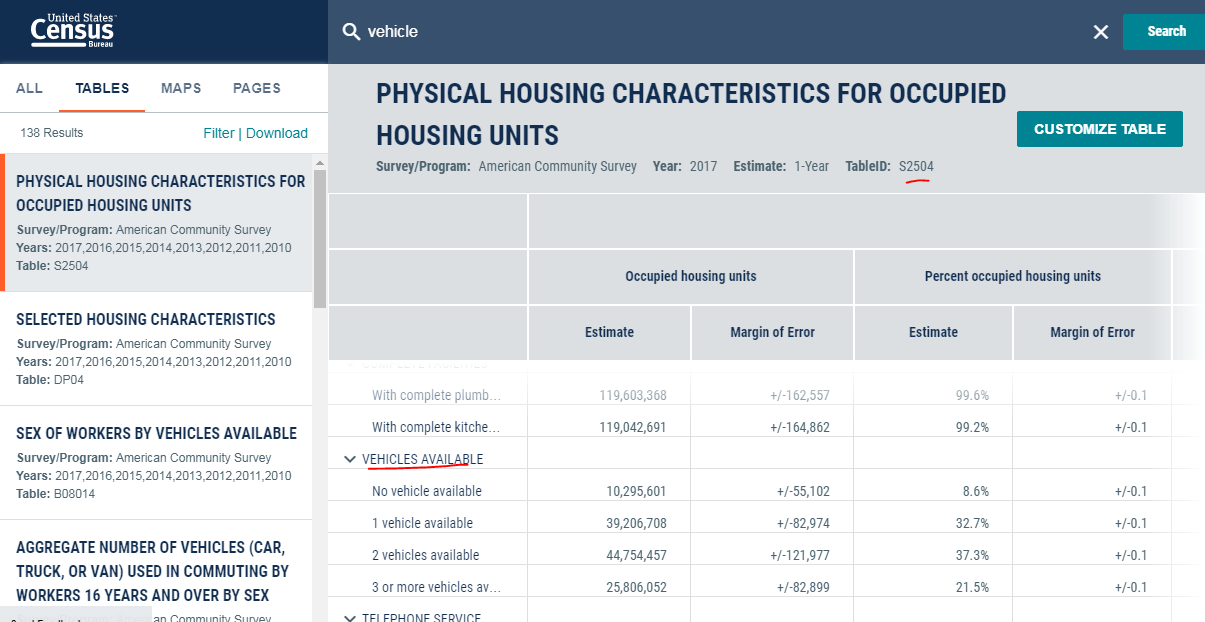
- Survey/Program: ACS
- Year: 2017
- Estimate: 1-year
-
TableID: S2504
2.Find the columns
/2017/acs/acs1/subject/groups/S2504.html
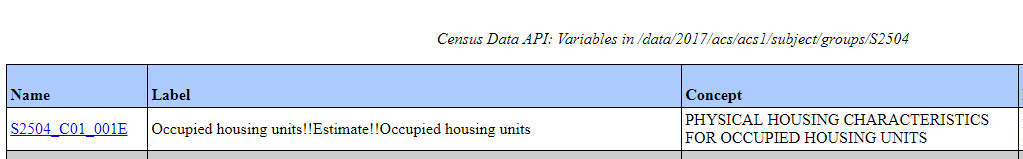
Since there is no column with the percentage of households that own one or more vehicles, we have to calculate it after the query by getting S2504_C01_027E(Occupied housing units with no vehicle available) and S2504_C01_001E (Total Occupied housing units). By subtracting housing units with no vehicles from the total housing units we can get the amount of housing units with vehicles.
Alternatively you can sum up S2504_C01_028E (1 vehicle available), S2504_C01_029E (2 vehicles available), and S2504_C01_030E (3 or more vehicles available).
3.Geographic Hierarchy
We can either use the FIPS state code for New York State (36) or use the latlng as the base of the hierarchy. Then add additional query for all (“*”) counties.
"geoHierarchy": {
      "state": "36",
      "county": "*"
}

//using latlng
"geoHierarchy": {
    "state": {
        "lat":  42.650272,
        "lng":  -73.758381
    },
    "county": "*"
}
4.Now we can construct the query using the information collected.
{
  "sourcePath" : ["acs","acs1","subject"],
  "vintage" : 2017,
  "values" : ["NAME","S2504_C01_027E","S2504_C01_001E"],
	"geoHierarchy": {
	    "state": "36",
	    "county": "*"
	}
}

//result
[
  {
    "NAME": "Albany County, New York",
    "S2504_C01_027E": 18637,
    "S2504_C01_001E": 124144,
    "state": "36",
    "county": "001"
  },
  {
    "NAME": "Bronx County, New York",
    "S2504_C01_027E": 296458,
    "S2504_C01_001E": 503985,
    "state": "36",
    "county": "005"
  },
  {
    "NAME": "Broome County, New York",
    "S2504_C01_027E": 11307,
    "S2504_C01_001E": 78604,
    "state": "36",
    "county": "007"
  },
...
]
An additional column “NAME” is added to get the name of the county which is more descriptive then a FIPS id.
5.To get the results back from a query we need setup a function callback that will return error and response (result) in the census function
census(
  {
    sourcePath: ["acs", "acs1", "subject"],
    vintage: 2017,
    values: ["NAME", "S2504_C01_027E", "S2504_C01_001E"],
    geoHierarchy: {
      state: "36",
      county: "*"
    }
  },
  function(error, response) {
    console.log(response);
  }
);
6.Now we have access to the response variable to calculate the percentage of households that own one or more vehicles. Since the response is an array of objects, we can use the map function to iterate though each item (county) and return back an object percentage and county name.
...
function(error, response){
	console.log(response)

	const percentage_households_w_vehicles = response.map(function(county){
		const total_households = county["S2504_C01_001E"];
		const households_wo_vehicles = county["S2504_C01_027E"];

		//subtract to get the total households with vehicles (one or more)
		const households_w_vehicles =    total_households - households_wo_vehicles;

		//get percentage
		const percentage_households_w_vehicles = households_w_vehicles / total_households;

		//return object
		return {
			"percent" : percentage_households_w_vehicles,
			"name" :  county['NAME']
		}
	})

console.log(percentage_households_w_vehicles)
// [
//	{percent: 0.8498759505090863, name: "Albany County, New York"},
//	{percent: 0.41177217575919917, name: "Bronx County, New York"},
//	{percent: 0.8561523586585924, name: "Broome County, New York"},
//	{percent: 0.8784301606922126, name: "Cattaraugus County, New York"},
//...
//]
})
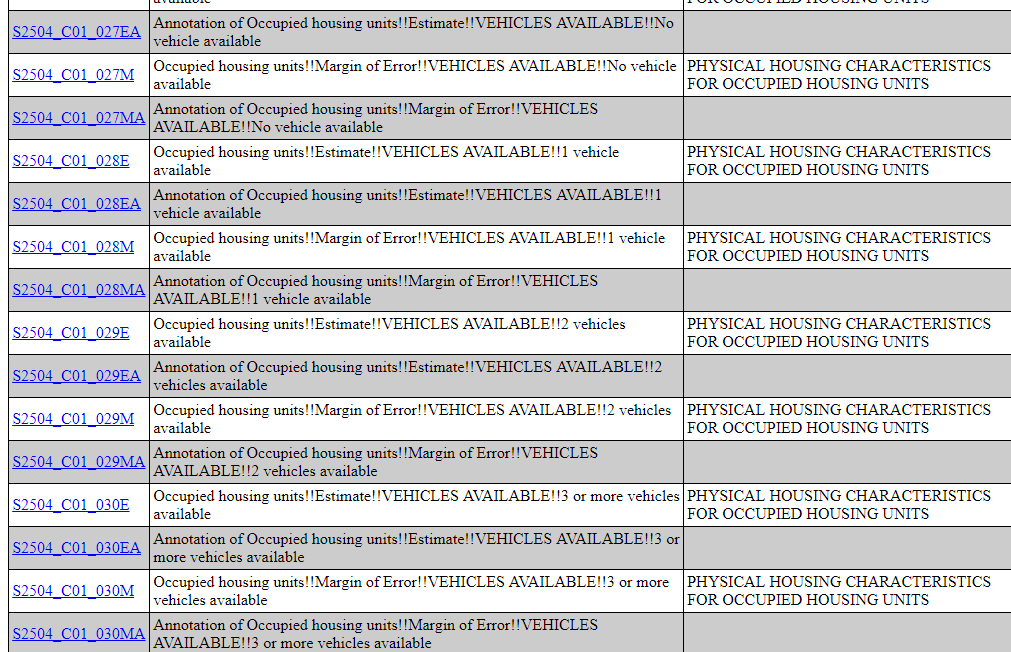
7.We can use Javascript to render the data onto the DOM (webpage)
First add an container to your body with a unique id.
<body>
  <div id="container"></div>
</body>
In your callback function add the following.
...
function(error, response){
	...

	//get DOM element
	const container = document.getElementById('container');

	//sort counties by percentages
	const counties_sorted = percentage_households_w_vehicles.sort(function(a,b){
		return a.percent - b.percent;
	});

	//generate list
	const counties_list = counties_sorted.map(function(county){
		return `<li><b>${county.name}</b> : ${county.percent}</li>`
	}).join('')

	//set the innerHTML to the generated list
	container.innerHTML = `<ul>${counties_list}</ul>`;
}
Now your the percentage of households in all New York counties will display on your webpage, sorted by lowest to highest.
Final result
See the Pen eqvaNr by ZHeCensus (@zhecensus) on CodePen.
Tip you can change any value like vintage year to explore temporal changes, or use a different state for comparisons.
GeoJSON
Lastly CitySDK also offers geojson return if you would like to map your data. By adding geoResolution key with a resolution (500k, 5m, 20m).
{
  "sourcePath" : ["acs","acs1","subject"],
  "vintage" : 2017,
  "values" : ["NAME","S2504_C01_027E","S2504_C01_001E"],
	"geoHierarchy": {
	    "state": "36",
	    "county": "*"
	},
	"geoResolution": "20m"
}
See the examples section to find out how to display the data on a map using GeoJSON, or examples other visualizations.
Getting Help
The community section provides many resources on getting up with your projects. The most responsive is the Slack Channel.
Previous: Geographies