Mapbox dynamic loading
This example shows how to setup a choropleth map using mapbox with dynamic loading. The data used is the unweighted count, estimate-total, and travel-time aggregate values for all block groups in a county. By dynamic loading for only a single county, it avoids pulling large amounts of data and crashing the browser. See the completed example here and source code here
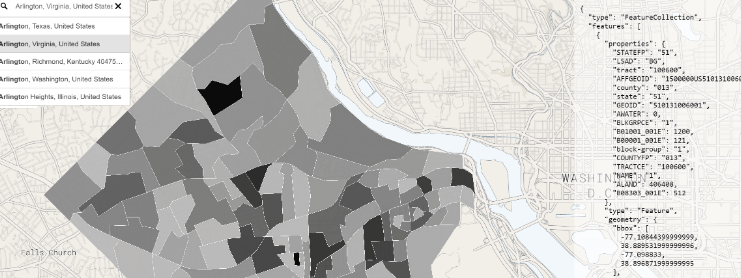
When the geocoder (address search) result is processed it return an event with a latlng point. From that a point it will query CitySDK for GeoJSON data and add it to the map using the styles generated.
geocoder.on("result", function(ev) {
  let sourceUID = makeid(); // random characters
  let layerUID = makeid();
  let point = {
    lng: ev.result.geometry.coordinates[0],
    lat: ev.result.geometry.coordinates[1]
  };

  let Args = {
    vintage: 2016,
    geoHierarchy: {
      county: point,
      "block group": "*"
    },
    sourcePath: ["acs", "acs5"],
    values: ["B00001_001E", "B01001_001E", "B08303_001E"],
    geoResolution: "500k"
  };
  // using census promise
  getCensusData(Args).then(function(res) {
    map.addSource(sourceUID, {
      type: "geojson",
      data: res.data
    });
    map.addLayer({
      id: layerUID,
      type: "fill",
      source: sourceUID,
      paint: {
        "fill-color": {
          property: selection,
          stops: res.stops
        },
        "fill-outline-color": "#ffffff",
        "fill-opacity": 0.8
      }
    });
  });
});