Mapbox choropleth map using vector tiles
This example shows how to setup a choropleth map using Mapbox. The data used is the Means of Transportation to Work - Table B08134 from ACS 5-year (2019). Mapbox vector tiles provides better performance when rendering large amount of polygons compared to GeoJSON. This code is adapted from Mapbox’s Data Joins tutorial.
If you would like to use GeoJSON with Mapbox check out the Additional Notes below. It is much simpler than using vector tiles but it is discouraged to load all counties or small geographies via GeoJSON due to the large size of such files.
See the completed example here. See additional example for tracts here.
Setting up
Import libraries and styles in the head. You can download citysdk.js here or build it using browserify.
<script src="https://api.tiles.mapbox.com/mapbox-gl-js/v1.2.0/mapbox-gl.js"></script>
<link
  href="https://api.tiles.mapbox.com/mapbox-gl-js/v1.2.0/mapbox-gl.css"
  rel="stylesheet"
/>
<script src="./citysdk.js"></script>
In the body setup a container with an id of map and add styles.
<style>
  body {
    margin: 0;
    padding: 0;
  }
  #map {
    position: absolute;
    top: 0;
    bottom: 0;
    width: 100%;
  }
</style>
<div id="map"></div>
In a script tag after the map div, we initialize the map with mapbox accessToken you can get from here
mapboxgl.accessToken = "<your access token here>";
var map = new mapboxgl.Map({
  container: "map",
  style: "mapbox://styles/mapbox/streets-v11",
  center: { lat: 37.0902, lng: -95.7129 },
  zoom: 3
});
Adding the Vector tiles
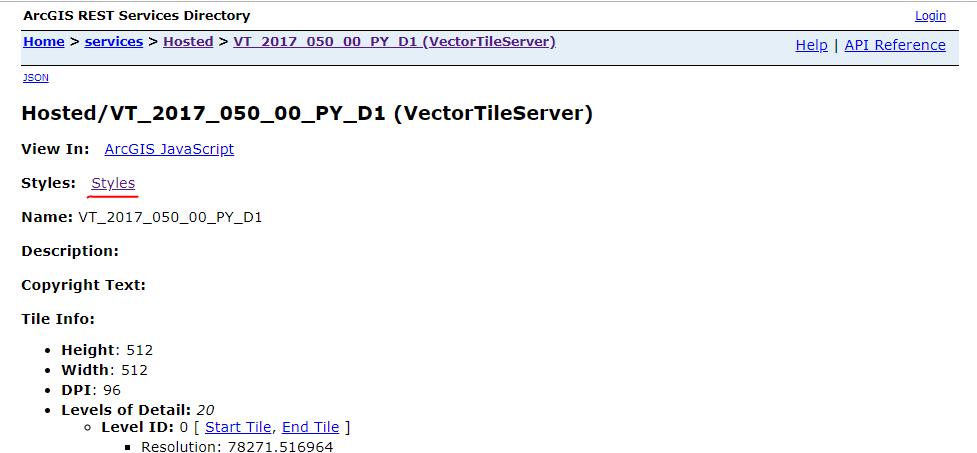
Census Bureau provides vector tiles via ArcGIS REST Services for various years and geographic levels.
Currently the directory for the available services is disabled, but you can use the mapdata API to find your vector layers. https://data.census.gov/api/mapdata?vintage=2019. Modify the vintage year to match your query.
To locate the vector layer look for your geography level id or geography name. So for county level we can look for VT_2019_050 using find (ctrl + f) in your browser, or look for where displayName:County.
Here are a few geographic level ids for common levels:
010 = United States
020 = Region
030 = Division
040 = State
050 = ….. County
060 = ….. ….. County Subdivision
140 = ….. ….. Census Tract
860 = ….. 5-Digit ZIP Code Tabulation Area
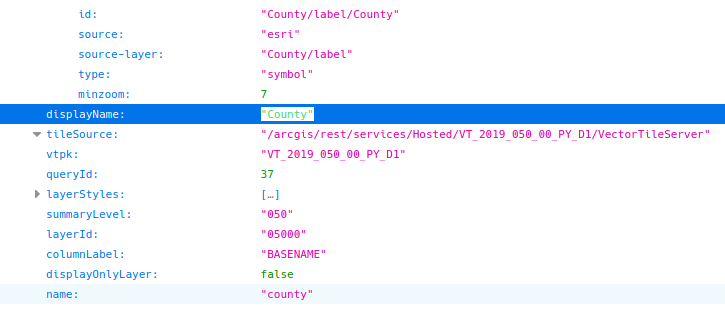
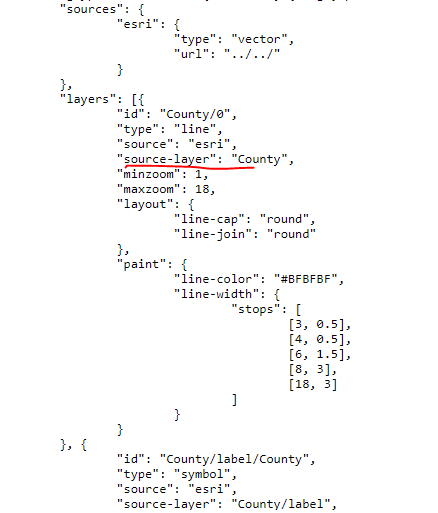
The layer that we need is Hosted/VT_2019_050_00_PY_D1. Next we have to get the source-layer name. Click into the Styles and find the source-layer value. (in this case it is “County”)
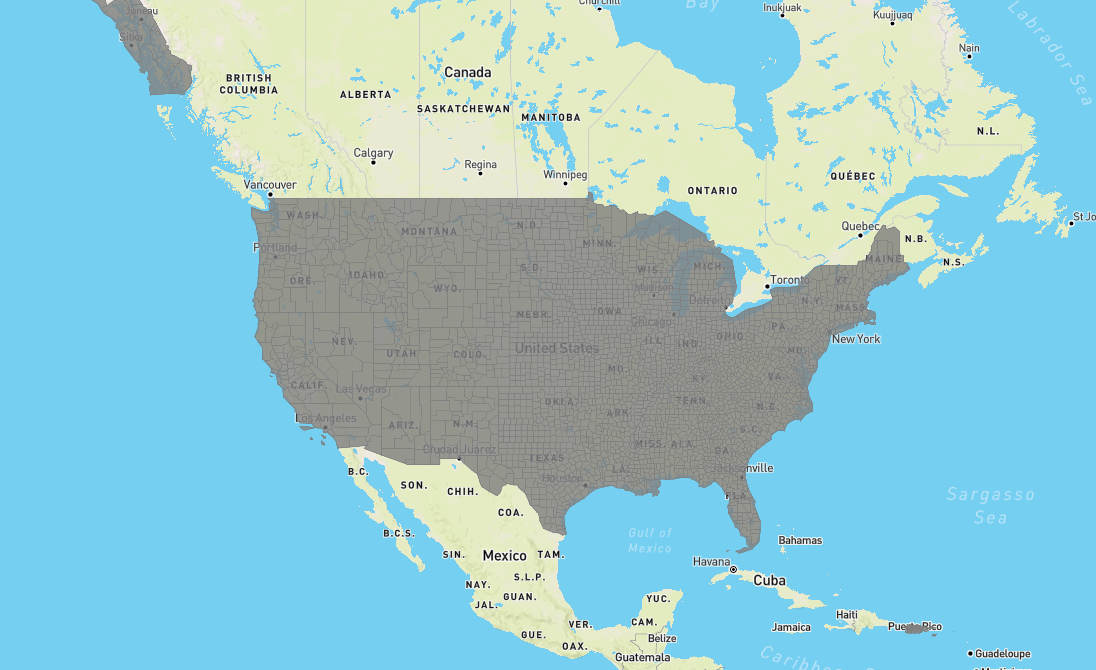
Now lets load the vector tiles layer, then add a simple grey fill layer. Notice that we also put in the parameter of promoteId to be GEOID, this will be used as a foreign key to join to our CitySdk response.
map.on("load", function() {
  map.addSource("counties", {
    type: "vector",
    tiles: ["https://gis.data.census.gov/arcgis/rest/services/Hosted/VT_2019_050_00_PY_D1/VectorTileServer/tile/{z}/{y}/{x}.pbf"],
    promoteId: "GEOID" // promote field to be used as a foreign key
  })

  map.addLayer({
    id: "counties-fill",
    type: "fill",
    source: "counties",
    "source-layer": "County",
    paint: {
      "fill-opacity": 0.8,
      "fill-color": "grey"
    }
  });
});
Query data
We use CitySDK to query for variable B08134_001E (est Total) and B08134_011E (est Car, truck, or van)
census(
  {
    vintage: 2019,
    geoHierarchy: {
      county: "*"
    },
    sourcePath: ["acs", "acs5"],
    values: ["NAME", "B08134_001E", "B08134_011E"]
  },
  (error, response) => {
    console.log(response);
  }
);
Merging data with vector tiles
Vector tiles do not contain any values other than GEOID and Name, so we need to join the CitySDK data to the vector tiles using the setFeatureState method in Mapbox. setFeatureState needs to be run on each county (row) of your response.
In your CitySDK callback, for each row in your response create a GEOID then run the setFeatureState method passing in a first object with source (the source created using addSource), sourceLayer (found in the Styles json), and id (a value that matches with the promoteId). Then a second object with all other fields from your response.
(error, response) => {
  //console.log(response);

  response.forEach((row) => {
    const GEOID = row.state + row.county
    map.setFeatureState({
      source: "counties",
      sourceLayer: "County",
      //promote field to be used as the primary key
      id: GEOID
    }, {
      //promote fields to be styled or interacted with
      name: row.NAME,
      car_truck_van_count: row.B08134_011E,
      total : row.B08134_001E,
      value: row.B08134_011E / row.B08134_001E
    })
  })
}
We can style the layer using feature-state
map.setPaintProperty("counties-fill", "fill-color", [
  "interpolate",
  ["linear"],
  ["feature-state", "value"],
  0.3,
  "#fef0d9",
  0.6,
  "#fdcc8a",
  0.8,
  "#fc8d59",
  0.9,
  "#e34a33",
  1,
  "#b30000"
]);
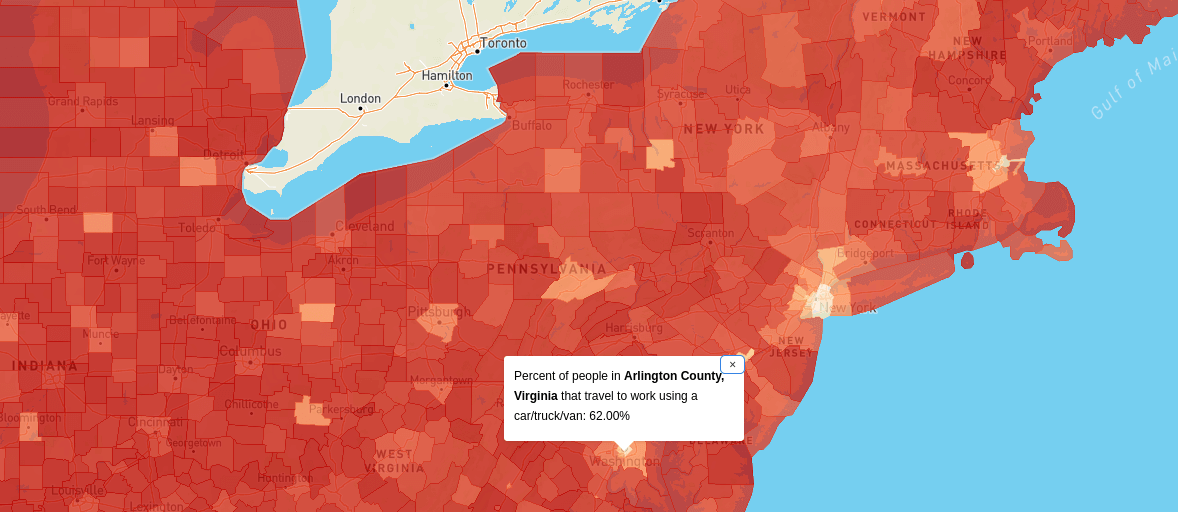
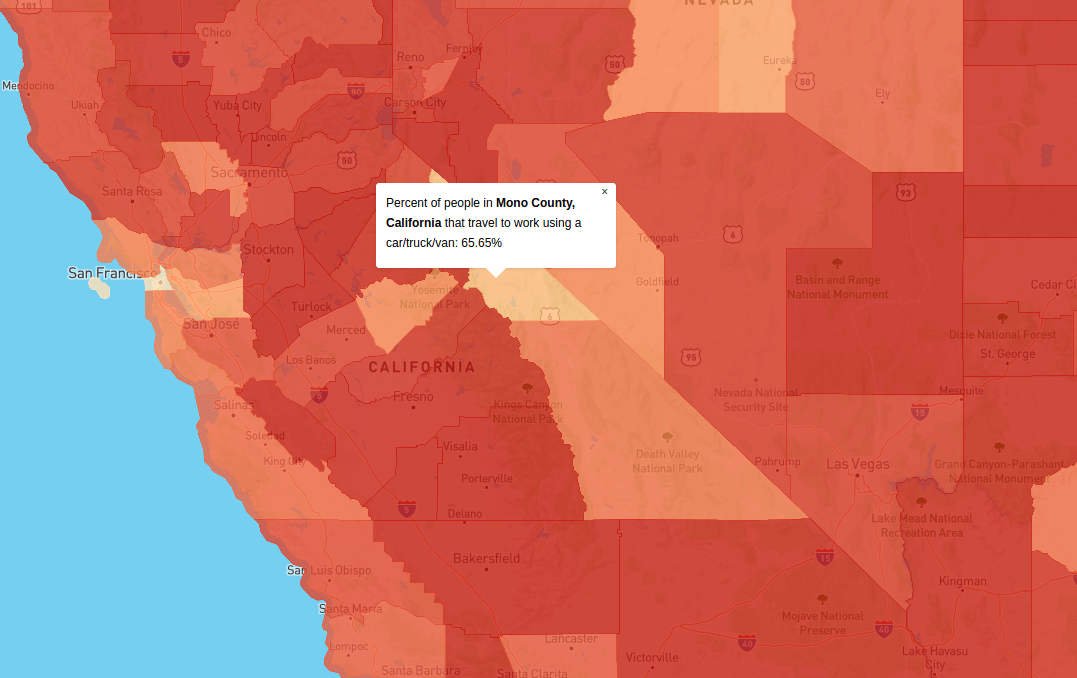
And add popups using map.queryRenderedFeatures then pulling out the state
map.on("click", "counties-fill", e => {
  const features = map.queryRenderedFeatures(e.point, { layers: ["counties-fill"] });

  if (features.length > 0) {
    const { state, properties } = features[0]

    const percent = `${(state.value * 100).toFixed(2)}%`

    new mapboxgl.Popup()
      .setLngLat(e.lngLat)
      .setHTML(`Percent of people in <strong>${state.name}</strong> that travel to work using a car/truck/van: ${percent}`)
      .addTo(map);
  }
});
Completed map and code should look like this.
map.on("load", () => {
  //setup source and layer
  map.addSource("counties", {
    type: "vector",
    tiles: ["https://gis.data.census.gov/arcgis/rest/services/Hosted/VT_2019_050_00_PY_D1/VectorTileServer/tile/{z}/{y}/{x}.pbf"],
    promoteId: "GEOID" // promote field to be used as a foreign key
  })

  map.addLayer({
    id: "counties-fill",
    type: "fill",
    source: "counties",
    "source-layer": "County",
    paint: {
      "fill-opacity": 0.8,
      "fill-color": "grey"
    }
  });

  //query using citysdk
  census(
    {
      vintage: 2019,
      geoHierarchy: {
        county: "*"
      },
      sourcePath: ["acs", "acs5"],
      values: ["NAME", "B08134_001E", "B08134_011E"]
    },
    (error, response) => {
      //bind data to source layer
      response.forEach((row) => {
        const GEOID = row.state + row.county
        map.setFeatureState({
          source: "counties",
          sourceLayer: "County",
          //promote field to be used as the primary key
          id: GEOID
        }, {
          //promote fields to be styled or interacted with
          name: row.NAME,
          car_truck_van_count: row.B08134_011E,
          total : row.B08134_001E,
          value: row.B08134_011E / row.B08134_001E
        })
      })

      //update paint to display choropleth
      map.setPaintProperty("counties-fill", "fill-color", [
        "interpolate",
        ["linear"],
        ["feature-state", "value"],
        0.3,
        "#fef0d9",
        0.6,
        "#fdcc8a",
        0.8,
        "#fc8d59",
        0.9,
        "#e34a33",
        1,
        "#b30000"
      ]);

      map.on("click", "counties-fill", e => {
        const features = map.queryRenderedFeatures(e.point, { layers: ["counties-fill"] });

        if (features.length > 0) {
          const { state, properties } = features[0]

          const percent = `${(state.value * 100).toFixed(2)}%`

          new mapboxgl.Popup()
            .setLngLat(e.lngLat)
            .setHTML(`Percent of people in <strong>${state.name}</strong> that travel to work using a car/truck/van: ${percent}`)
            .addTo(map);
        }
      });
    })
});
Census Tract Example
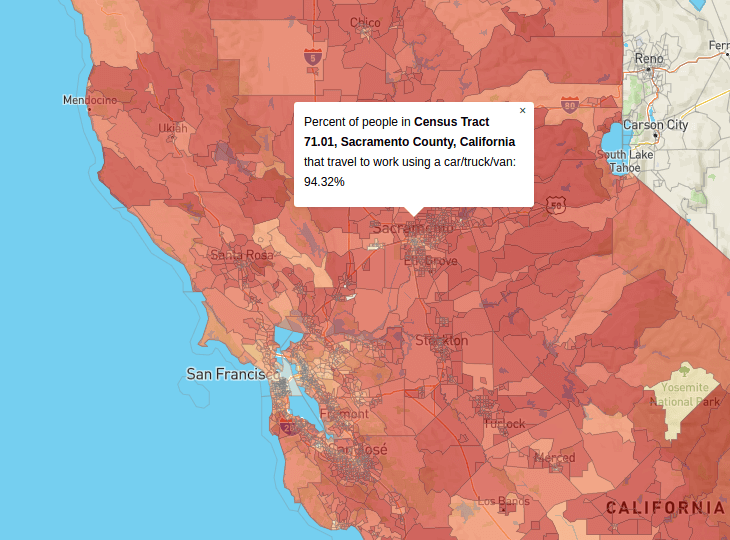
Since we are using tracts, we use level 140 and find the endpoint of Hosted/VT_2019_140_00_PY_D1. Looking at the styles we find that the source-layer is CensusTract.
Note: Census Tract Vector Tiles will only load for zoom levels 9 and above. If you don’t see anything zoom in!
map.addSource("tracts", {
  type: "vector",
  tiles: ["https://gis.data.census.gov/arcgis/rest/services/Hosted/VT_2019_140_00_PY_D1/VectorTileServer/tile/{z}/{y}/{x}.pbf"],
  promoteId: "GEOID" // promote field to be used as a foreign key
})

map.addLayer({
  id: "tracts-fill",
  type: "fill",
  source: "tracts",
  "source-layer": "CensusTract",
  paint: {
    "fill-opacity": 0.8,
    "fill-color": "grey"
  }
});
Then we query CitySDK for all the tracts in state of California, calculate the GEOID, and lastly use the setFeatureState on the response. Lastly the tracts base on the values. I added an fill-opacity rule to hide ones without values (out of state or no population).
census(
{
  vintage: 2019,
  geoHierarchy: {
    state: "06",
    tract: "*"
  },
  sourcePath: ["acs", "acs5"],
  values: ["NAME", "B08134_001E", "B08134_011E"],
  statsKey: "3c04140849164b373c8b1da7d7cc8123ef71b7ab"
},
(error, response) => {
  response.forEach((row) => {
    const GEOID = row.state + row.county + row.tract
    map.setFeatureState({
      source: "tracts",
      sourceLayer: "CensusTract",
      id: GEOID
    }, {
      name: row.NAME,
      car_truck_van_count: row.B08134_011E,
      total: row.B08134_001E,
      value: row.B08134_011E / row.B08134_001E
    })
})

  //update paint to display choropleth
  map.setPaintProperty("tracts-fill", "fill-color", [
    "interpolate",
    ["linear"],
    ["feature-state", "value"],
    0.3,
    "#fef0d9",
    0.6,
    "#fdcc8a",
    0.8,
    "#fc8d59",
    0.9,
    "#e34a33",
    1,
    "#b30000"
  ]);

  //hide tracts without values
  map.setPaintProperty("tracts-fill", "fill-opacity", [
    "case",
    ["to-boolean", ["feature-state", "value"]],
    0.6,
    0
  ]);

}
Tip: If you want tracts in other states, you can run this block/ convert this into a function to take in a different FIPS code.
See the full code and example here.
Additional Notes
Using GeoJSON
For smaller queries using the GeoJSON provide the same results without the need of additional complex code to generate the color expression or look up the data. But note that load times might be longer as GeoJSON takes a while to pull from the Github/CDN.
map.on("load", function() {
  census(
    {
      vintage: 2017,
      geoHierarchy: {
        county: "*"
      },
      geoResolution: "5m",
      sourcePath: ["acs", "acs5"],
      values: ["NAME", "B19083_001E"]
    },
    function(error, response) {
      map.addLayer({
        id: "counties",
        type: "fill",
        source: {
          type: "geojson",
          data: response
        },
        paint: {
          "fill-opacity": 0.8,
          "fill-color": [
            "interpolate",
            ["linear"],
            ["get", "B19083_001E"],
            0.2,
            "#ffffb2",
            0.4,
            "#fecc5c",
            0.6,
            "#fd8d3c",
            0.8,
            "#f03b20",
            1,
            "#bd0026"
          ]
        }
      });

      map.on("click", "counties", function(e) {
        var coordinates = e.lngLat;
        //look up GINI value
        var properties = e.features[0].properties;

        new mapboxgl.Popup()
          .setLngLat(coordinates)
          .setHTML(
            "GINI value for " + properties.NAME + ": " + properties.B19083_001E
          )
          .addTo(map);
      });
    }
  );
});