Choropleth map using leaflet
This example shows how to setup a choropleth map using leaflet to display a percentage. See the completed example here. Adapted from leaflet’s example
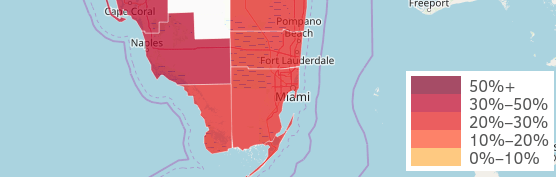
The data used is the population 60 years and over from ACS 5-year Subject tables. We will calcuate the percentage of the population 60 years and over for the counties of Florida.
Setting up
In the head import libraries and styles. You can download citysdk.js here or build it using browserify.
<link
  rel="stylesheet"
  href="https://unpkg.com/leaflet@1.5.1/dist/leaflet.css"
/>
<script src="https://unpkg.com/leaflet@1.5.1/dist/leaflet.js"></script>
<script src="./citysdk.js"></script>
In the body setup a container with an id of map, with a height and width.
<style>
  #map {
    height: 600px;
    width: 600px;
  }
</style>
<div id="map"></div>
In a script tag after the map div, we initialize the map.
var map = L.map("map").setView([28.466944, -82.498148], 7);
L.tileLayer("https://{s}.tile.openstreetmap.org/{z}/{x}/{y}.png", {
attribution:
'© <a href="https://www.openstreetmap.org/copyright">OpenStreetMap</a> contributors'
}).addTo(map);
Query and add data
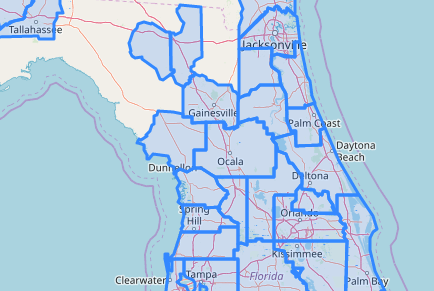
We use CitySDK to query for the geojson and values for the total and 60 years and older population. Then add the layer by calling L.geojson().addTo() and passing in the response as a CitySDK callback.
census(
  {
    vintage: 2019,
    geoHierarchy: {
      state: {
        lat: 28.466944,
        lng: -82.498148
      },
      county: "*"
    },
    geoResolution: "5m",
    sourcePath: ["acs", "acs5", "subject"],
    // Total!!Estimate!!Total population : S0102_C01_001E
    // 60 years and over!!Estimate!!Total population : S0102_C02_001E
    values: ["S0102_C01_001E", "S0102_C02_001E"]
  },
  function(error, response) {
    L.geoJson(response).addTo(map);
  }
);
This will result in a GeoJSON layer without any styles.
Styling
To add a style, first create function to return colors for the various scales, in the callback function.
...
function(error, response){
  ...

  function getColor(percent) {
    return percent > 50
      ? "#800026"
      : percent > 30
      ? "#BD0026"
      : percent > 20
      ? "#E31A1C"
      : percent > 10
      ? "#FC4E2A"
      : percent > 5
      ? "#FD8D3C"
      : percent > 0
      ? "#FEB24C"
      : "#FFF";
  }
}
Next we create a style function that will take in a feature (county) and get the values for the total population and population 60 and over from the feature properties. We check if both values are not zero or undefined for we divide to avoid errors. Lastly we calculate the percentage and return an object with the styles. Note that fillColor is determined by the color function we created in the previous codeblock.
function(error, response){
  ...
  function style(feature) {
    var total_pop = feature.properties.S0102_C01_001E;
    var total_pop_over60 = feature.properties.S0102_C02_001E;
    //calculate percent
    if (total_pop && total_pop_over60) {
      // check if valid (no 0s or undefined)
      var percent = (total_pop_over60 / total_pop) * 100;
      return {
        fillColor: getColor(percent),
        fillOpacity: 0.7,
        weight: 0.5,
        color: "rgba(255, 255, 255, 0.8)"
      };
    } else {
      return {
        weight: 2,
        fillOpacity: 0,
        weight: 0.5,
        color: "rgba(255, 255, 255, 0.8)"
      };
    }
  }
}
Now we can modify the L.geoJson function with an additional object as an argument. {style: style}.
L.geoJson(response, { style: style }).addTo(map);
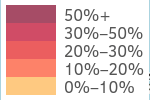
Lastly add a legend to the page, by adding an additional styles, and a legend and container div.
<style>
  .container {
    position: relative;
  }
  #map {
    height: 600px;
    width: 600px;
    z-index: 1;
  }

  #legend {
    line-height: 18px;
    color: #555;
    position: absolute;
    bottom: 40px;
    right: 20px;
    z-index: 2;
    background-color: white;
    padding: 5px;
  }
  #legend i {
    width: 50px;
    height: 18px;
    float: left;
    margin-right: 8px;
    opacity: 0.7;
  }
</style>

<div class="container">
  <div id="map"></div>
  <div id="legend"></div>
</div>
Next in the callback we create a grade scale, and select the legend DOM element. Then we run a forEach function to generate the HTML in the legend DOM element.
var grades = [50, 30, 20, 10, 0];
var div = document.getElementById("legend");
grades.forEach(function(grade, i) {
div.innerHTML +=
'<i style="background:' +
getColor(grades[i] + 1) +
'"></i> ' +
grades[i] +
"%" +
(grades[i - 1] ? "–" + grades[i - 1] + "%" : "+") +
"<br/>";
});
Additional Notes
Blank Polygons
You many notice some wholes in the data, this either because the is no population in the areas or data was not collected for the area.
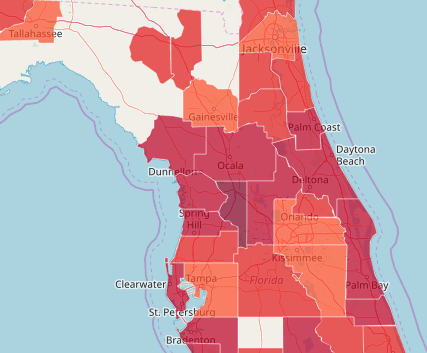
Color Scales
Setting color scales manually is a bit tedious, especially when the values are not especially. You can modify the function to use d3-scales and d3-scale-chromatic.
The example below shows how to show population 60 over instead of percentages. D3js will generate a linear color scale from the extent of the values and the range of colors.
For some datasets linear colors scale might not work well due to the distribution of the data, try using quantile or threshold scales.
<script src="https://d3js.org/d3.v5.min.js"></script>
<script>
  ...
  function(error, response) {
    //get values
    var values = response.features.map(function(feature) {
      return feature.properties.S0102_C02_001E;
    });

    var getColor = d3
      .scaleLinear()
      .domain(d3.extent(values)) // get the min and max values
      .range(d3.schemeReds[5]); // set 5 color buckets

    function style(feature) {
      var total_pop_over60 = feature.properties.S0102_C02_001E;

      return {
        fillColor: getColor(total_pop_over60),
        fillOpacity: 0.7,
        weight: 0.5,
        color: "rgba(255, 255, 255, 0.8)"
      };
    }
  }
</script>