Maps with D3js
This example shows how to setup map using D3.js and topojson. See the completed example here.
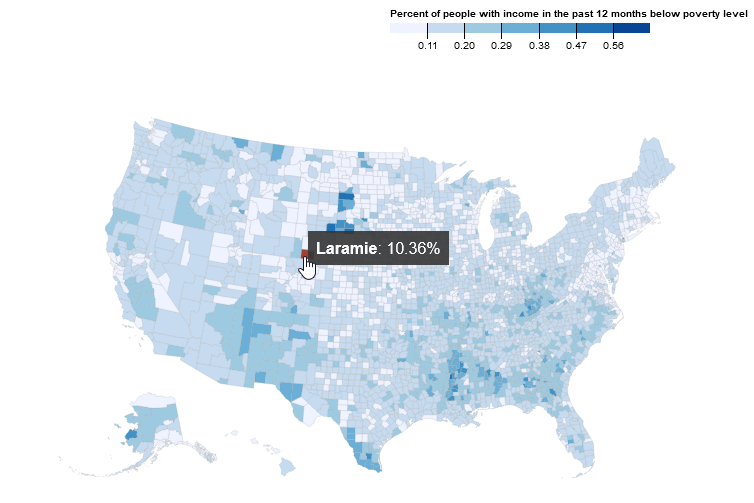
Alternately you can use the geojson provided by CitySDK for smaller queries. View a quick example in the additional notes below
to add…
Additional Notes
Using GeoJSON
//setup width, height, and svg
const width = 800,
  height = 600;
const map = d3
  .select("svg")
  .attr("width", width)
  .attr("height", height);

//projection
const projection = d3
  .geoAlbersUsa()
  .scale(width)
  .translate([width / 2, height / 2]);
const path = d3.geoPath(projection);

//call data
censusPromise({
  vintage: 2019,
  geoHierarchy: {
    county: "*"
  },
  sourcePath: ["acs", "acs5"],
  values: ["B17001_001E", "B17001_002E"],
  geoResolution: "20m"
}).then(data => {
  //generate color scale
  const extent = d3.extent(
    data.features.map(
      d => d.properties["B17001_002E"] / d.properties["B17001_001E"]
    )
  );
  const colorScale = d3
    .scaleQuantile()
    .domain(extent)
    .range(d3.schemeBlues[7]);

  //generate map
  map
    .append("g")
    .selectAll("path")
    .data(data.features)
    .enter()
    .append("path")
    .attr("d", path)
    .attr("fill", d => {
      return colorScale(
        d.properties["B17001_002E"] / d.properties["B17001_001E"]
      );
    });
});